Pennywise
A finance visualisation tool using Swift to display and chart spending.
Visualising Your Spending
PennyWise was created to give users a clear picture of where they spend their money.
Many people struggle to track expenses and budgets, and apps that are complicated discourage regularly using them.
This app simplifies financial data by connecting to APIs such as AIB and Revolut that pull in your transactions categorises them,
and presents them in a visually engaging way.
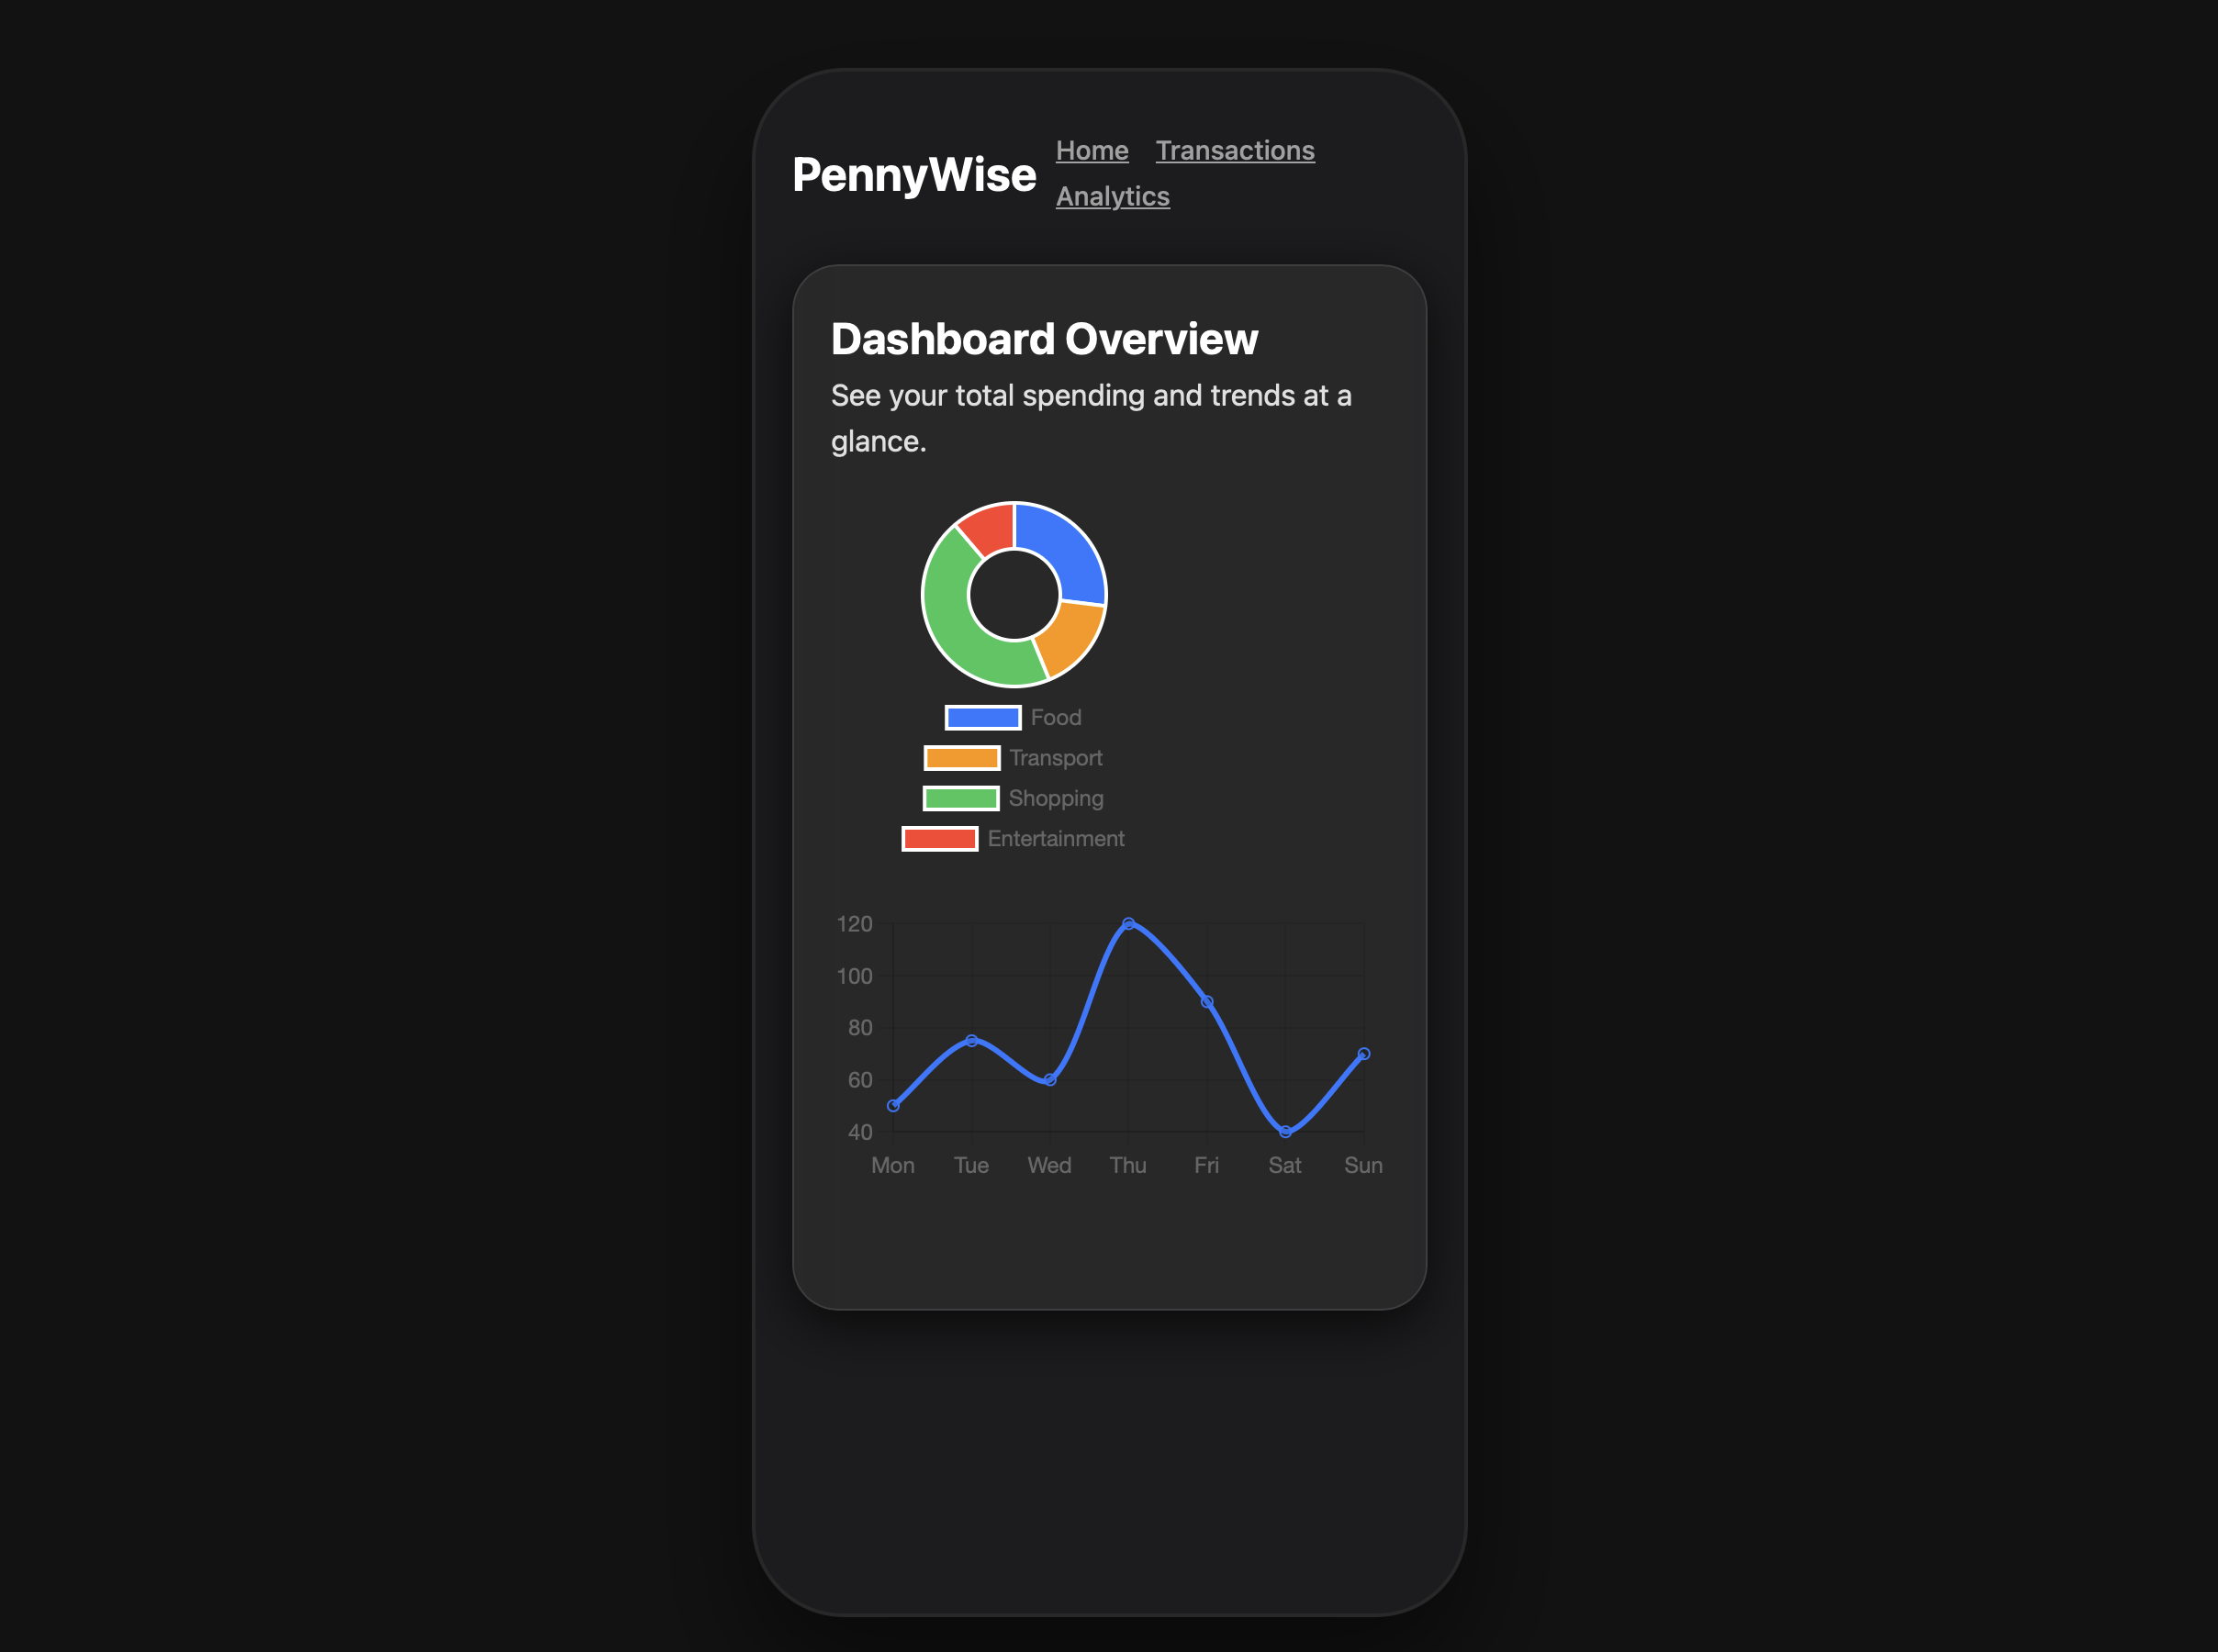
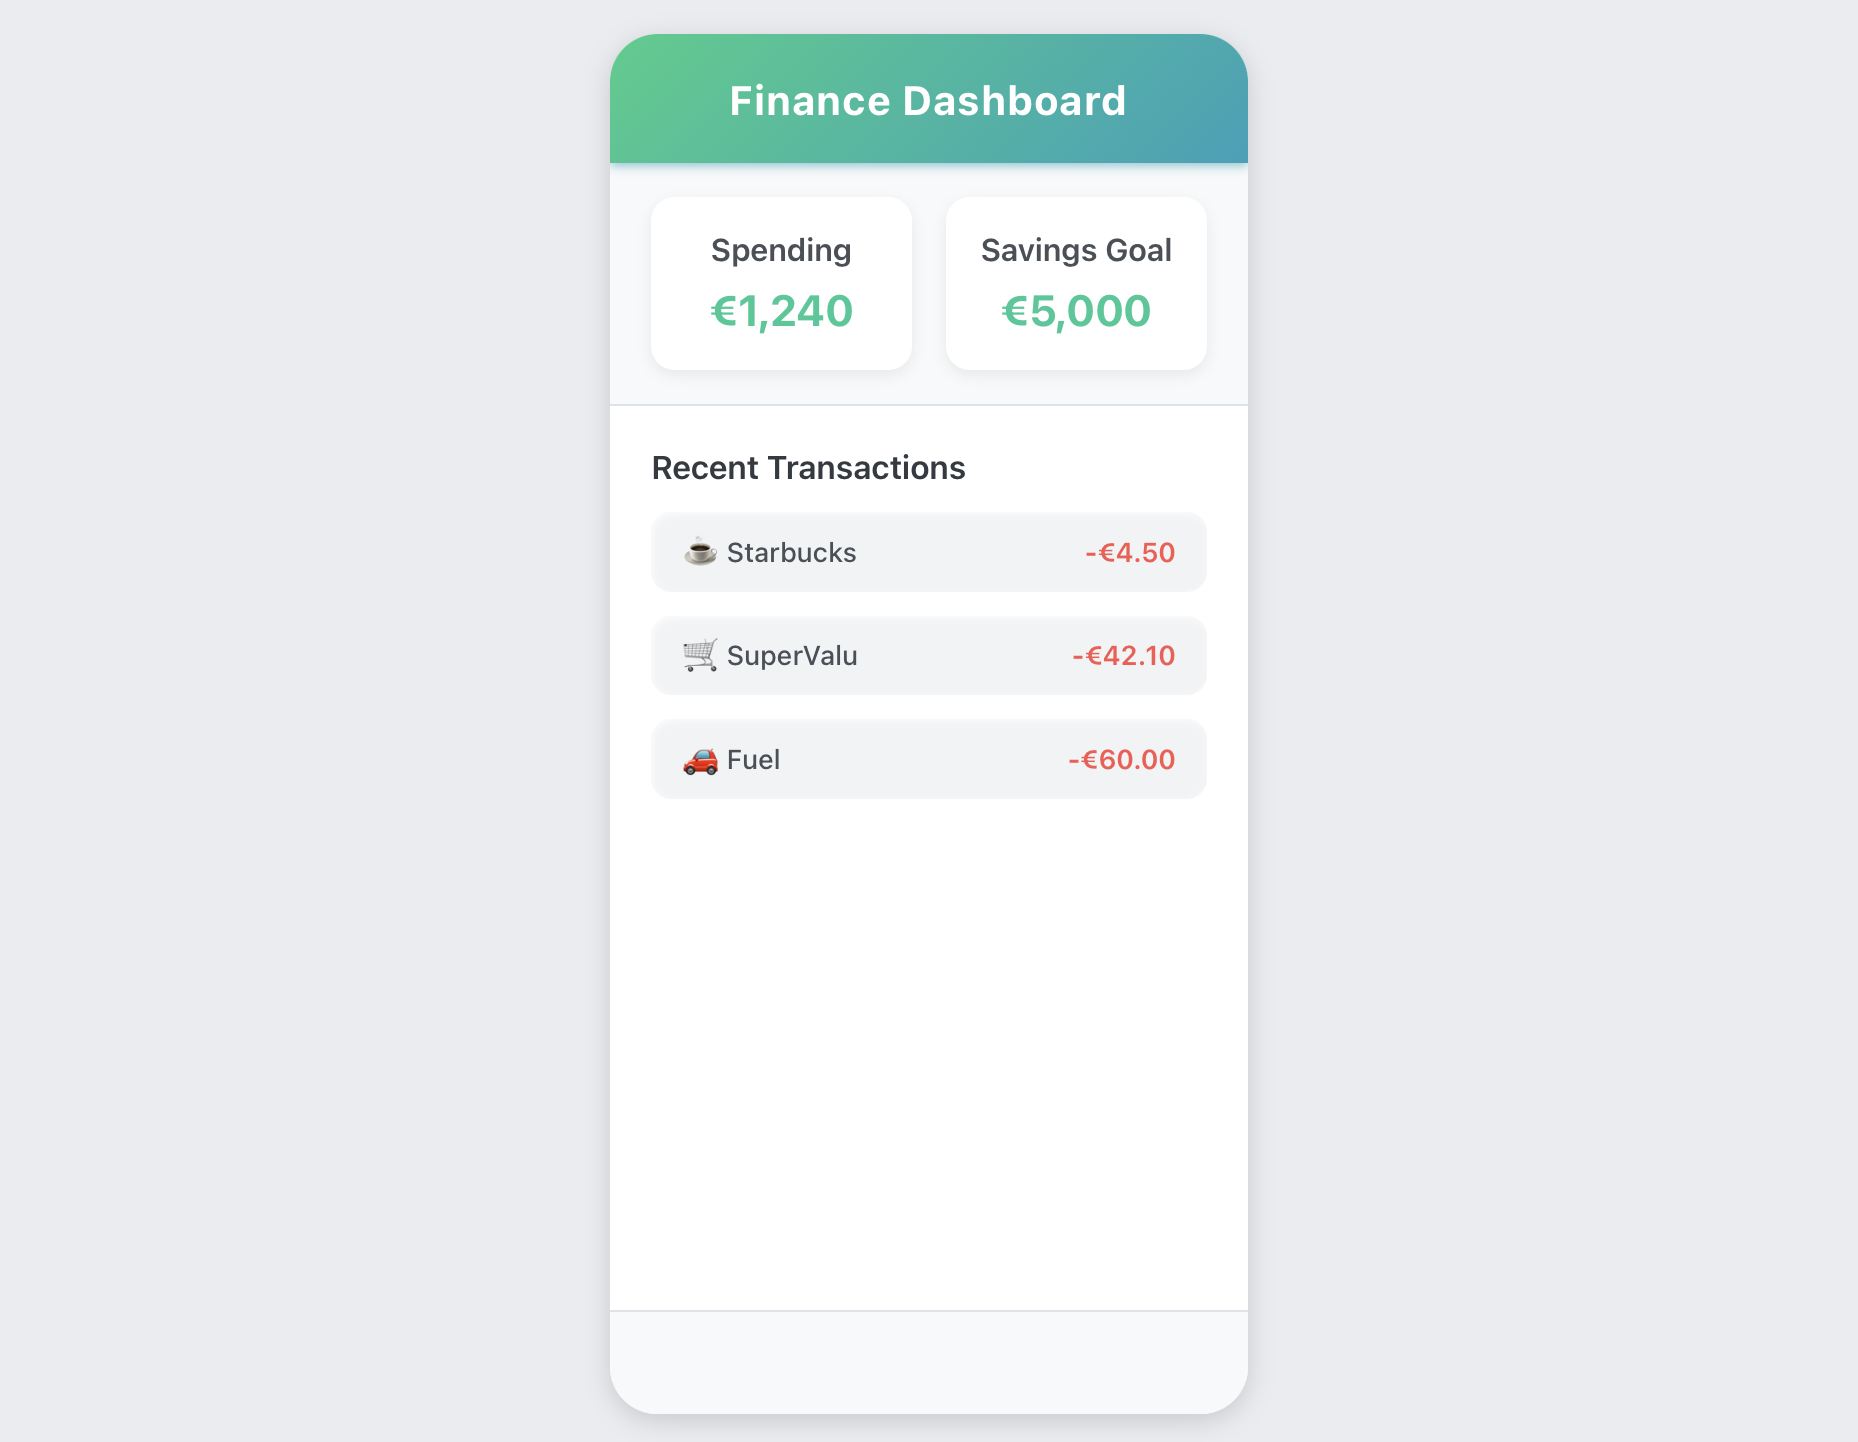
Clear Dashboards
The Dashboard is the heart of PennyWise. Users can quickly see spending by category, trends over time, and alerts for unusual spending. Charts are interactive, letting users tap to see details, zoom in on trends, and compare periods.
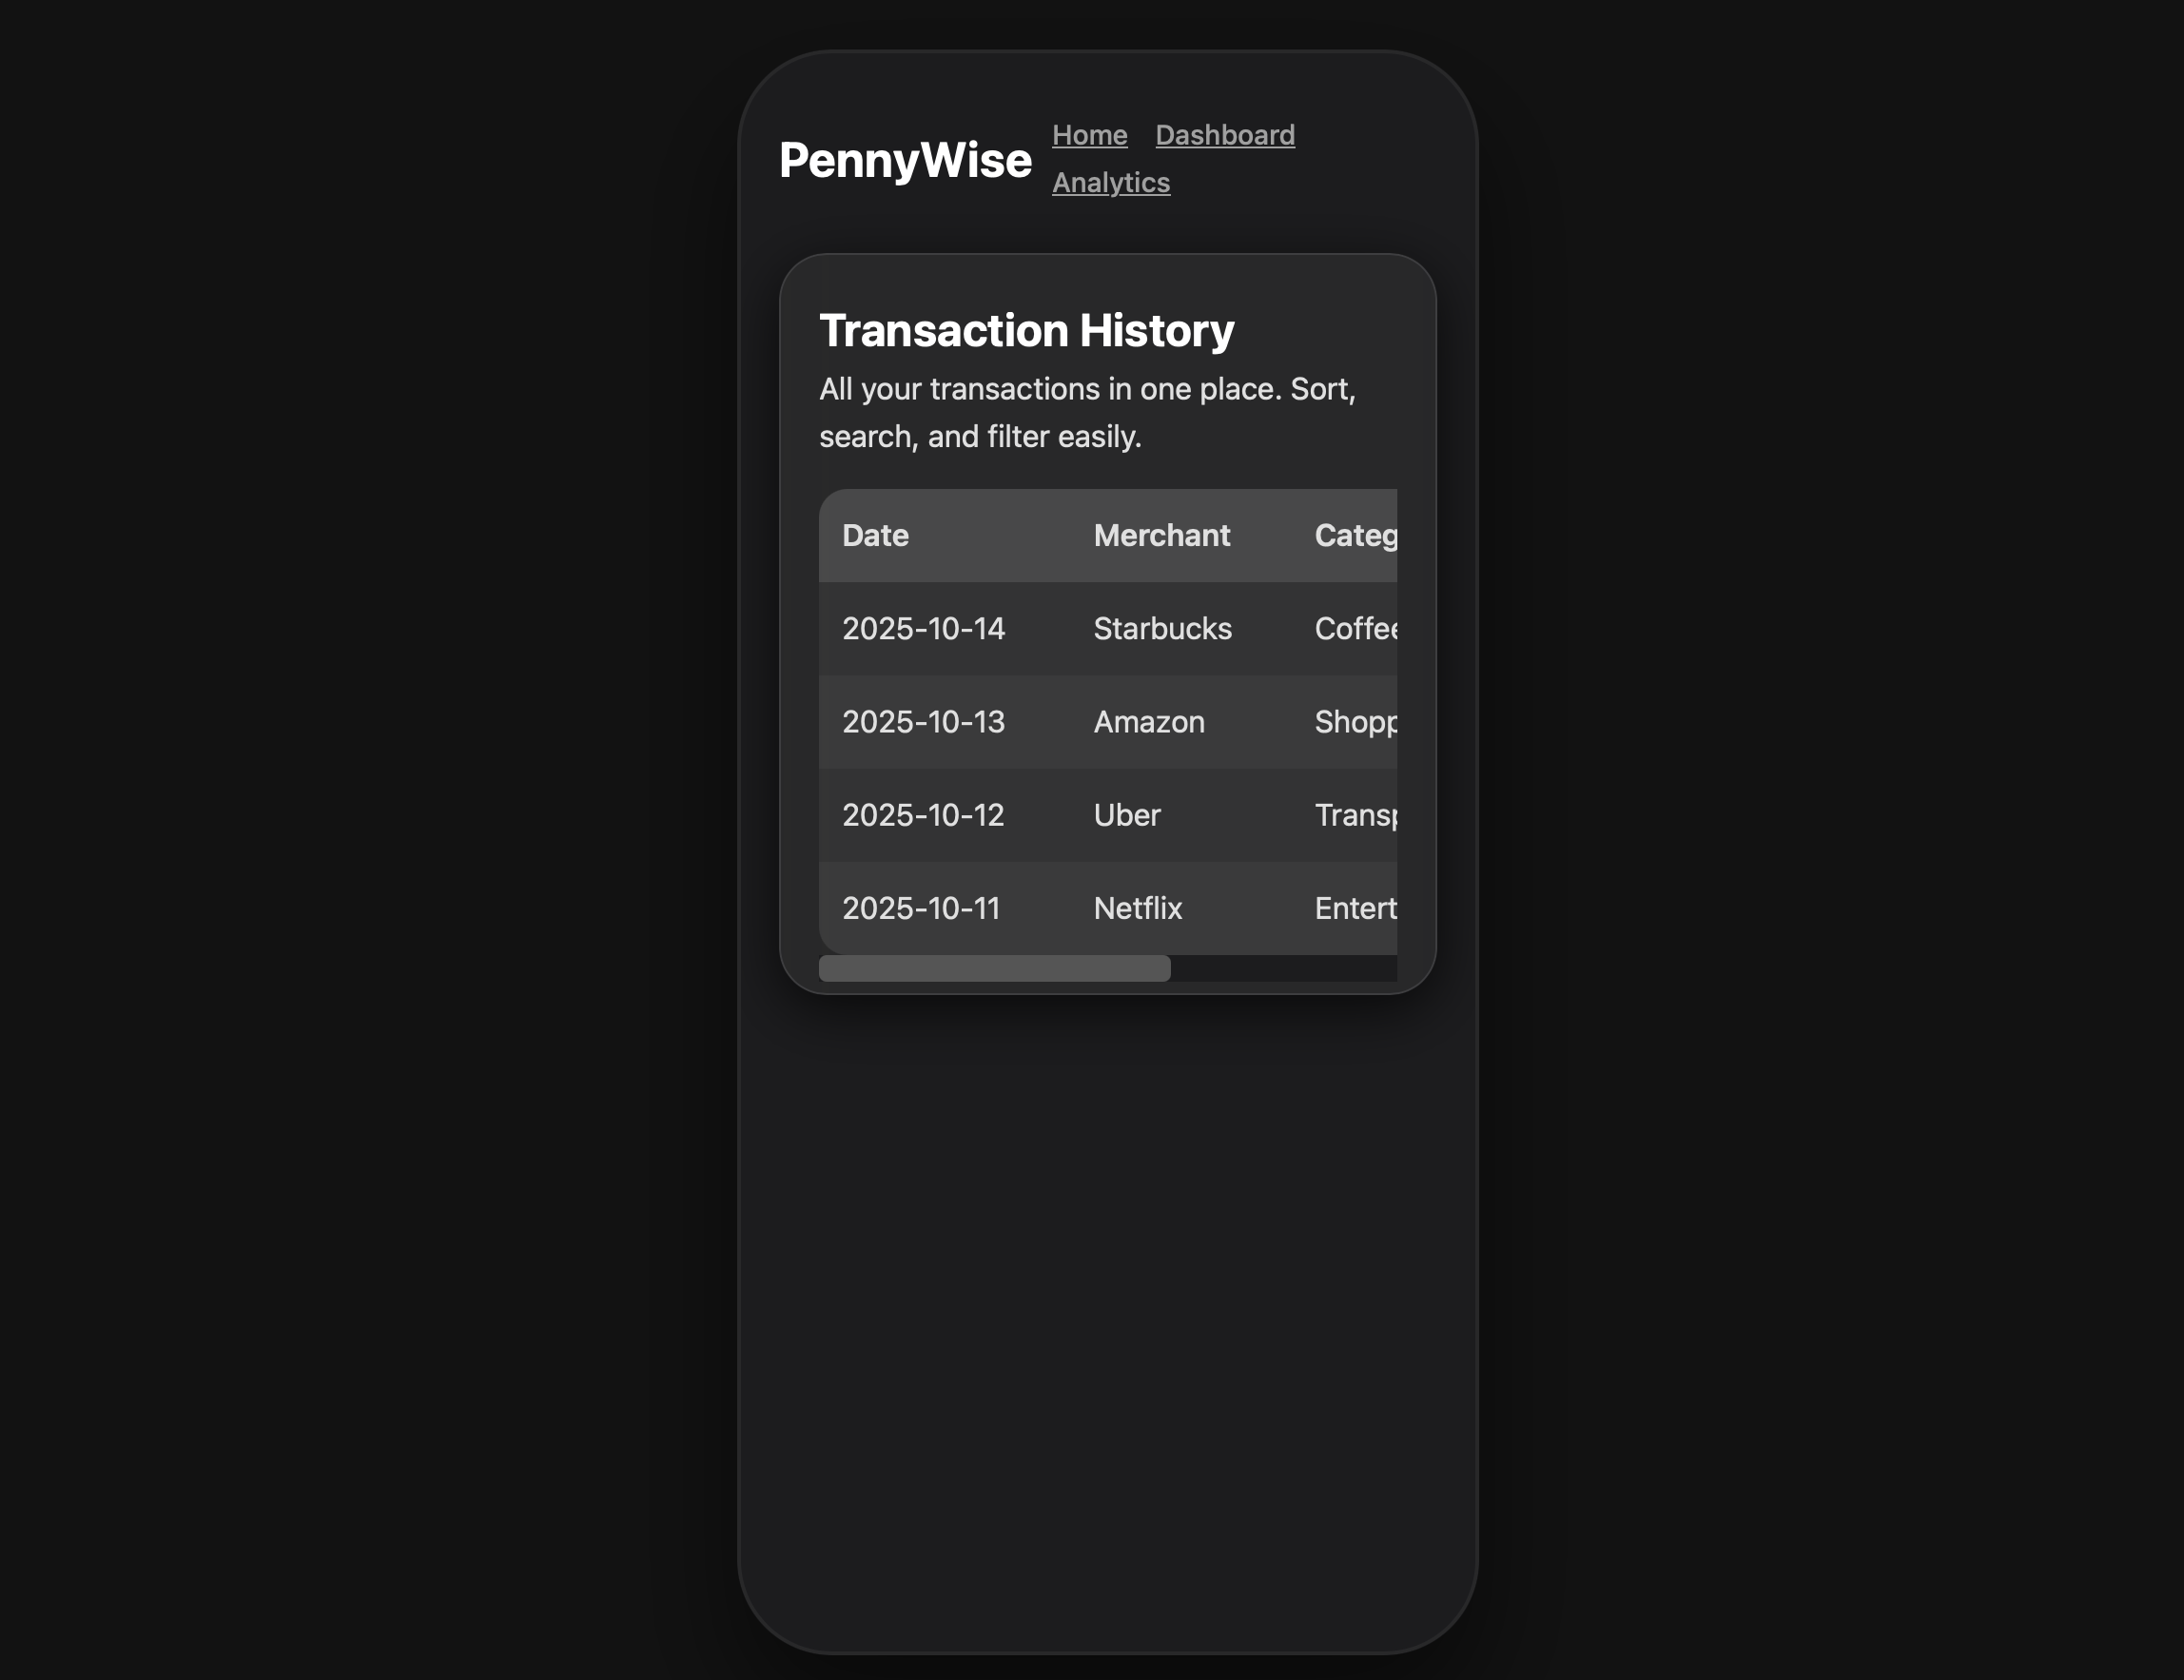
Track Every Transaction
The Transaction page displays all expenses in a clean, sortable table. Users can filter by category, search for specific merchants, and see a timeline of their spending. This helps users gain control over their finances by making their spending patterns visible and understandable.
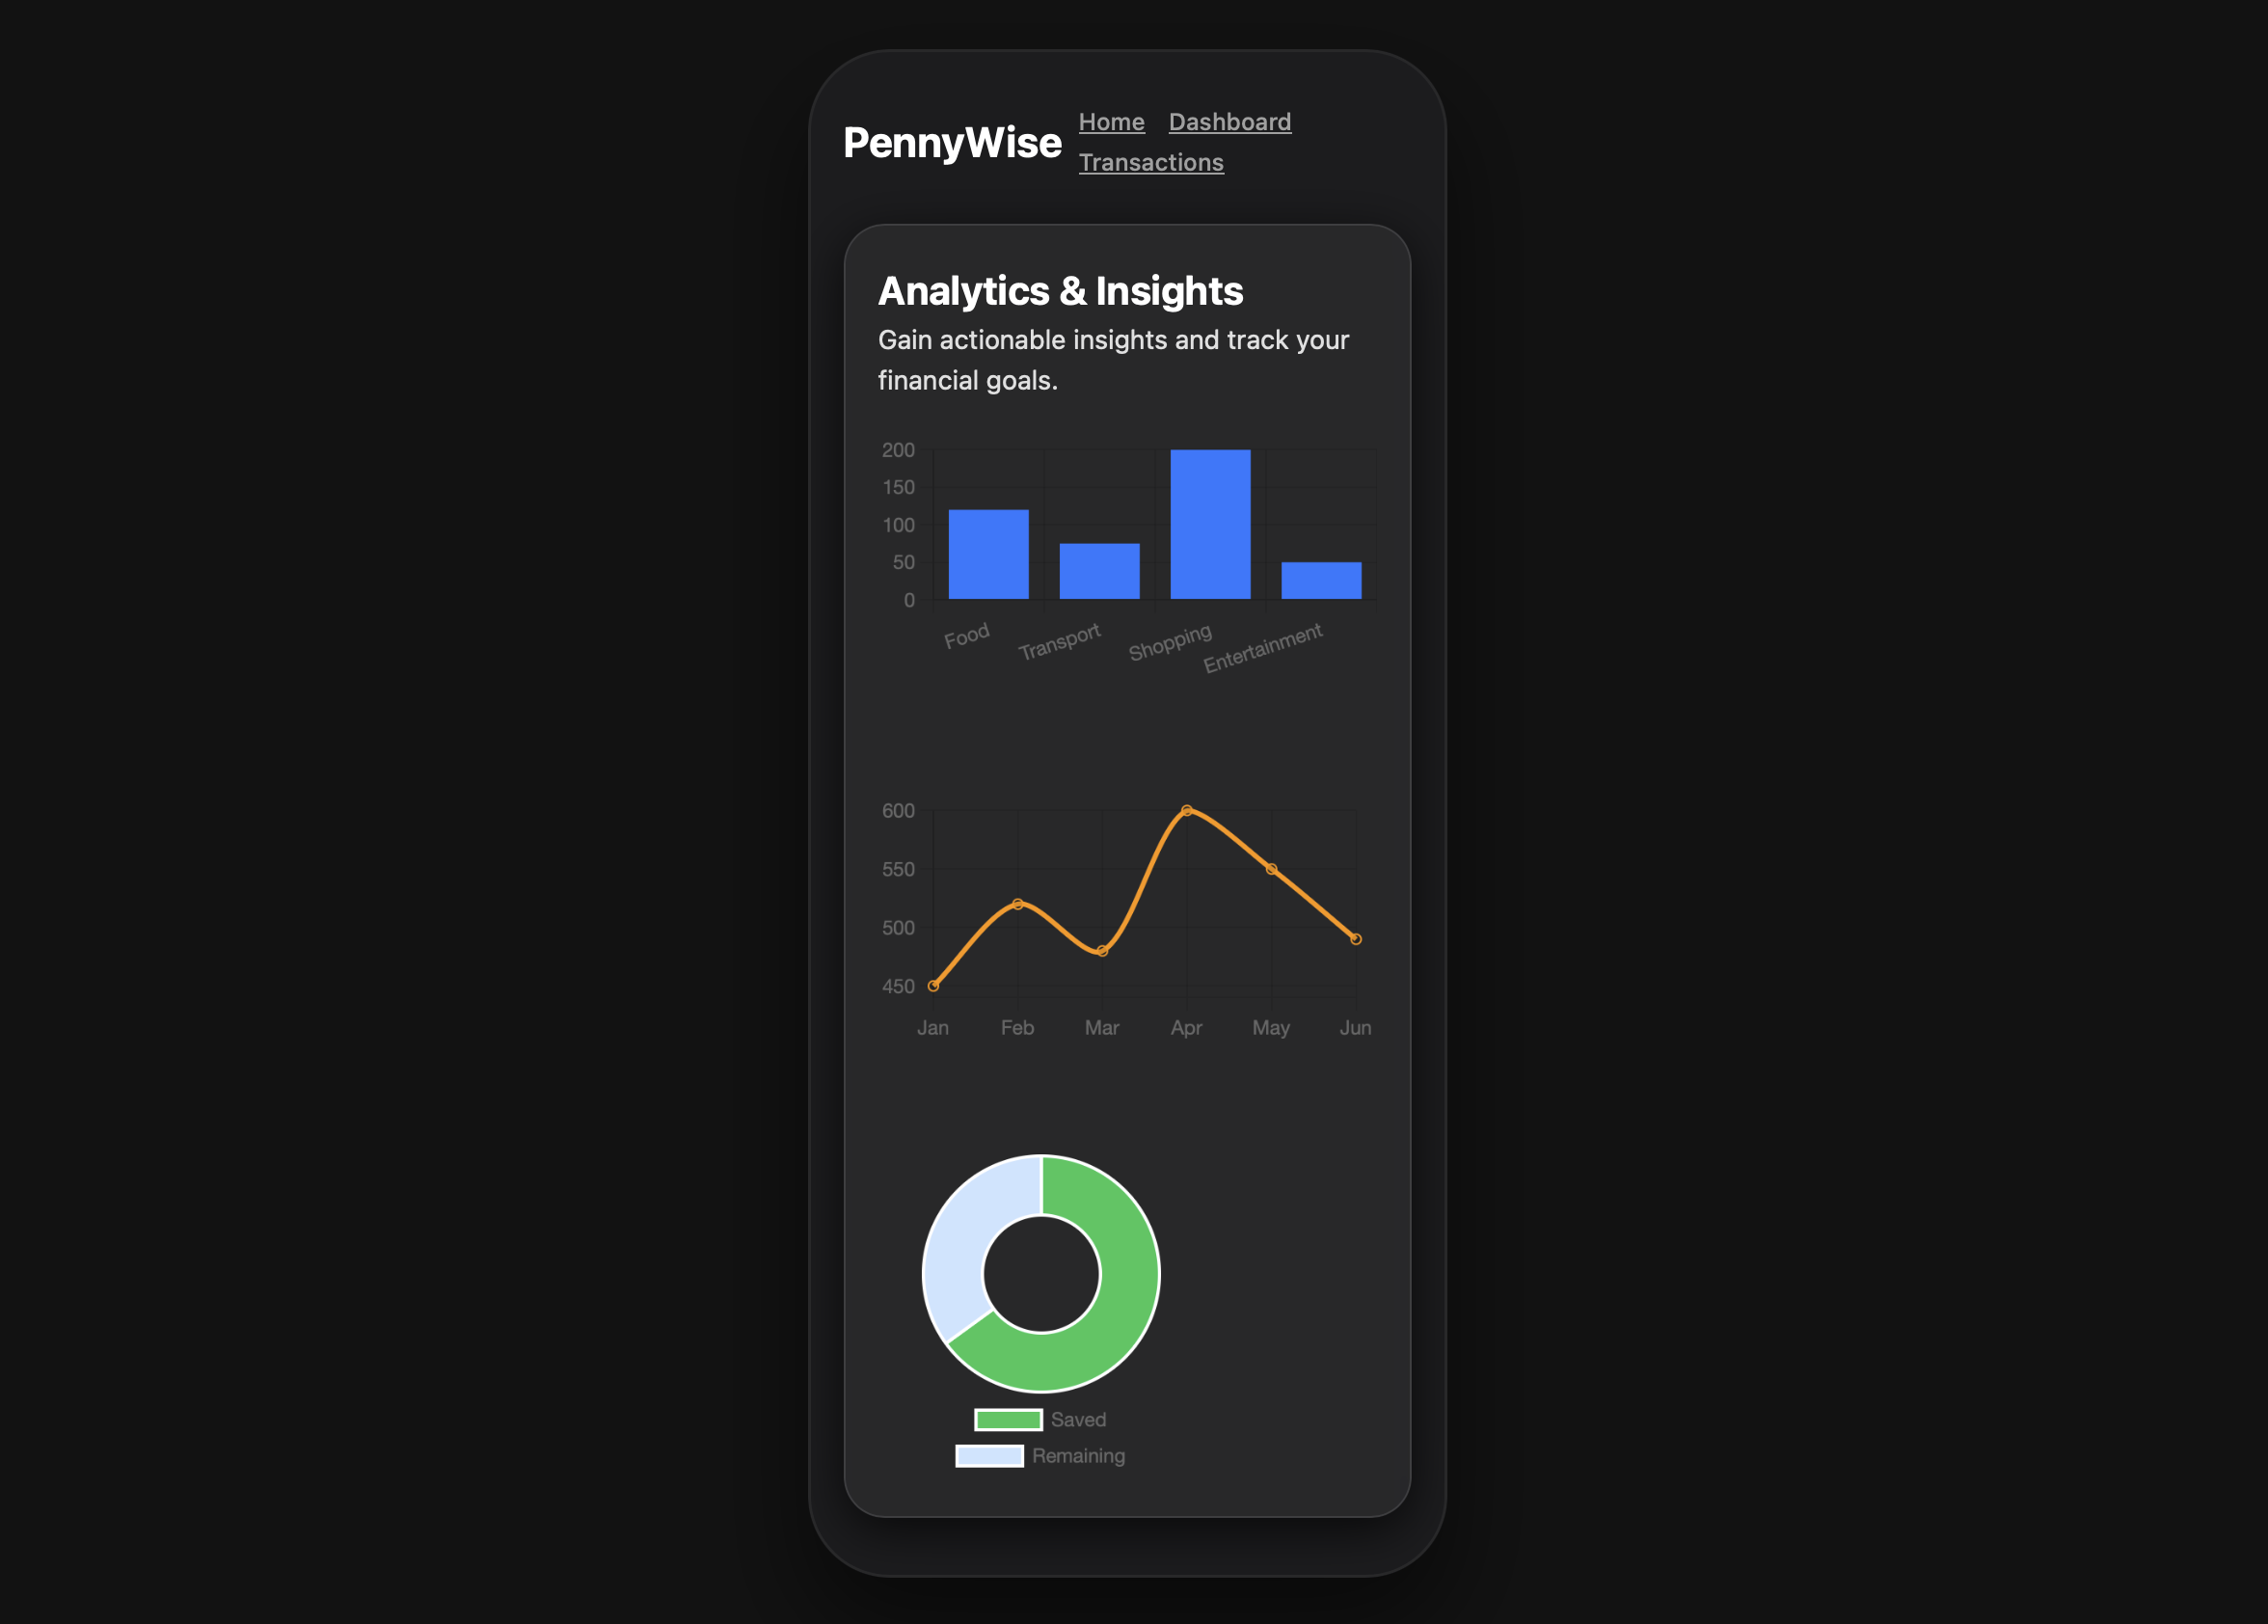
Insights for Better Decisions
PennyWise isn’t just about displaying numbers. Analytics provide actionable insights:
which categories are overspending, recurring payments, and monthly averages, what can I save on this month?
Users can set goals, track progress, and receive recommendations for saving smarter.
A personal financial advisor, available to you, all the time.