EDA
Exploratory Data Analysis (EDA) on Melbourne Housing using Julia and Pluto notebooks.
Getting the Data
The Melbourne Housing dataset contains property listings with attributes like price, suburb, rooms, distance from city, and type. This dataset was provided as part of the assignment and loaded into a Pluto notebook for analysis.
Exploratory Analysis
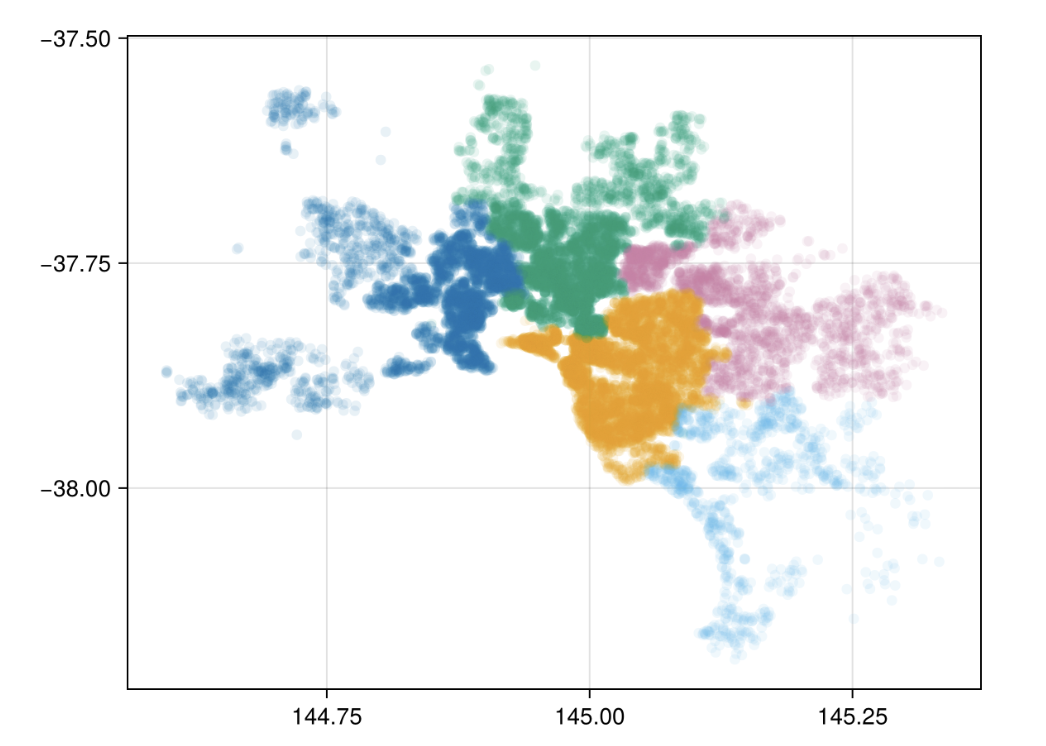
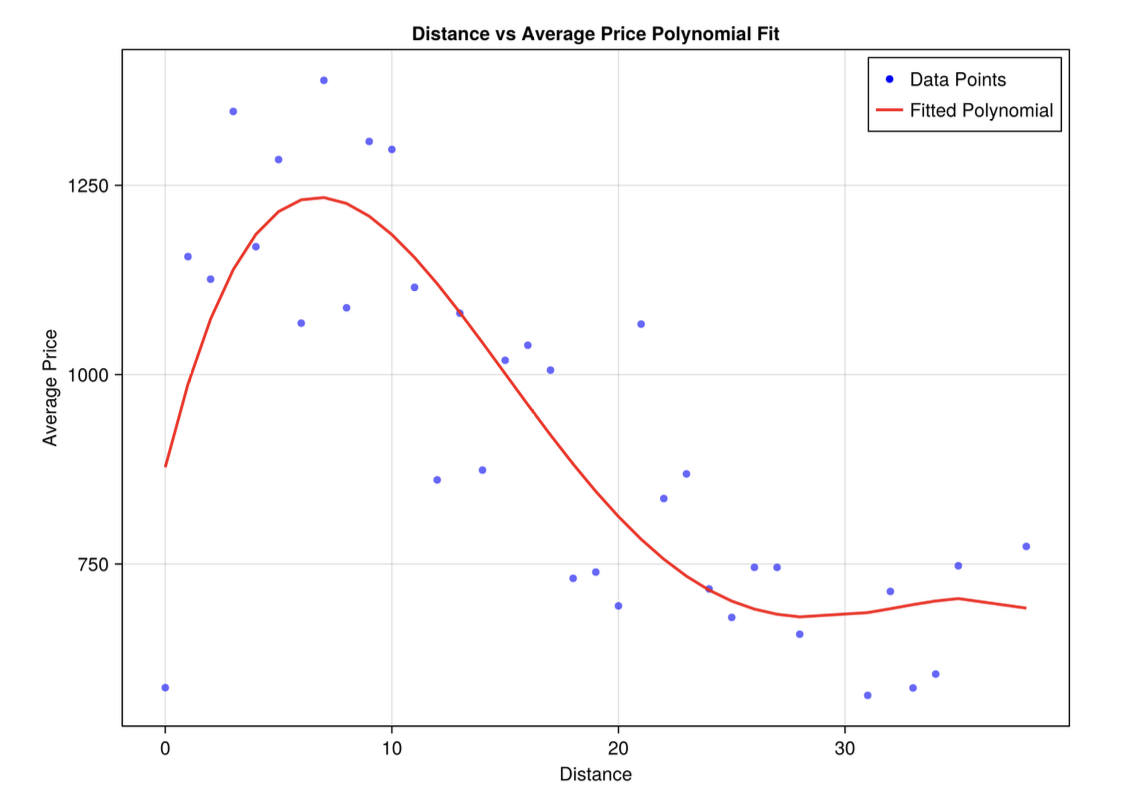
I began by examining the distribution of prices and key numerical features. Using Julia’s plotting libraries, I created histograms, boxplots, and scatter plots to identify trends, outliers, and correlations. For example, it was interesting to see how price varied with distance from the city center and number of rooms.
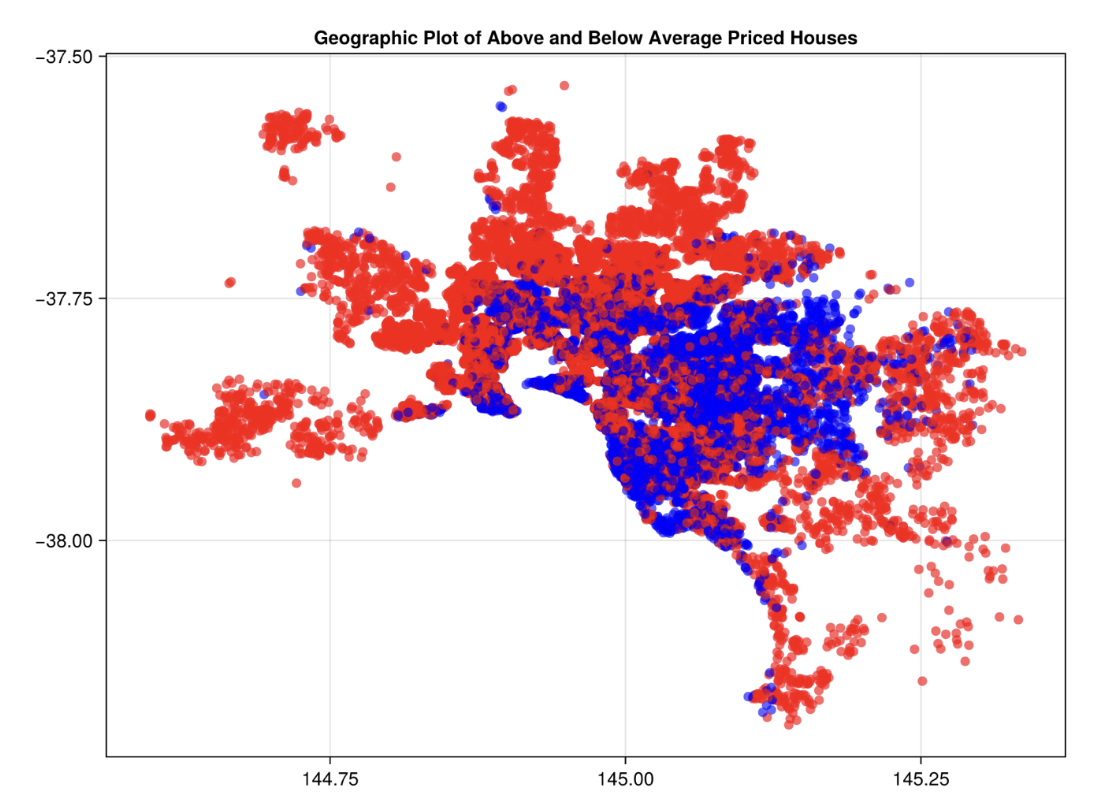
Insights from Visualisations
Median prices are higher in inner-city suburbs and decrease with distance. Properties with more rooms generally command higher prices, though there are notable outliers. Type of property (house, unit, or townhouse) strongly influences pricing. Visual patterns help identify potential data quality issues, such as missing values or extreme outliers.
Tools & Techniques
Julia: For data manipulation, cleaning, and plotting.
Pluto Notebooks: For interactive development, live code execution, and inline visualisations.
Data Visualisation Libraries: Plots.jl and StatsPlots.jl for graphs and exploratory charts.
What I Learned
This project was a great introduction to working with real datasets in Julia.
EDA helped uncover trends and anomalies in housing prices, and using Pluto notebooks made the workflow interactive and reproducible.
It also reinforced the importance of clear visualisations in data.